|
|
|||
|
|
|
|
|
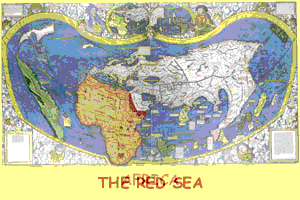
Waldseemüller's large Wall Map of 1507 shows the most complete world image of the maps. The animation walks through the various shapes as of 1507.
The scale changes in the maps that follow, so the shapes have
different sizes. As the mapmakers draw a larger territory, the
individual parts of the map become smaller. Notice this particularly
between the world maps and the portolan charts.